
There’s a version of fisheries monitoring that looks thorough on paper and produces data that managers mostly trust. Technicians on site at peak migration hours. Sonar counters running in the background. Periodic sampling to check species composition. The data goes into a report that goes to a regulator, and the cycle repeats.
We built the FishL Recognition system because we kept asking what that approach is actually missing. Not in theory. In practice, at real sites, during real migration runs.
The answer is: it misses quite a lot. It misses every fish that passes outside of sampling windows. It misses species detail in aggregate sonar counts. It misses the wild-to-hatchery breakdown that drives harvest allocation decisions. It misses real-time data that would let a manager act within the current season rather than responding to last season’s numbers.
The best fish imaging equipment for operational fisheries management needs to close those gaps, not just perform well in the conditions where conventional monitoring already works adequately.
Here’s what we built the FishL system to do that conventional approaches don’t:
- Process every fish that passes, not a sample, 24 hours a day without fatigue or scheduling gaps
- Classify species from AI algorithms trained on verified images across 12 or more Pacific and Atlantic species
- Distinguish wild from hatchery fish using adipose fin detection, without prior tagging of the population
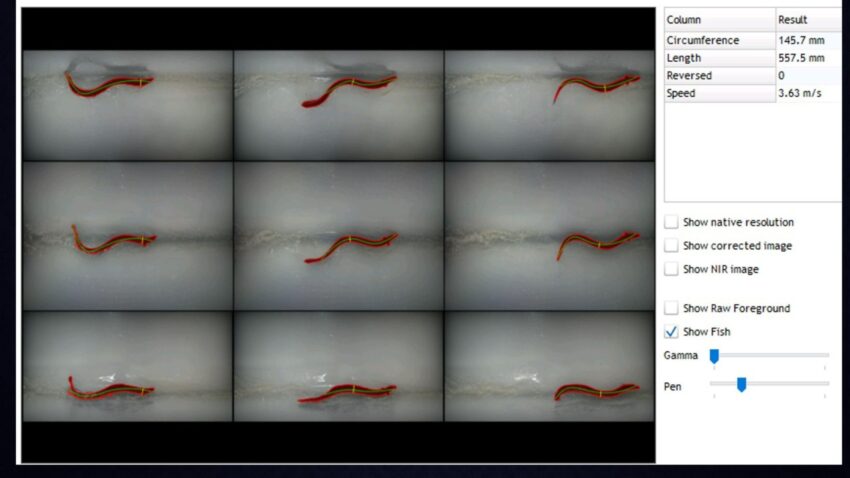
- Measure fork length and girth from multi-angle imaging without handling the fish
- Log water temperature and flow rate at time of passage alongside each fish record
- Attach full image files to every record, creating an auditable data trail for compliance and research use
Why Does Completeness Matter More Than Sample Accuracy?
A highly accurate sample is still a sample. It describes a fraction of the run and models the rest. If the sampled fraction is representative, the model is approximately right. If it’s not, for reasons like run timing shifts, species composition changes, or sampling windows that don’t align with peak passage hours, the model can be significantly wrong without anyone knowing it until the post-season analysis comes back.
A complete count with high classification accuracy is a different kind of data product entirely. It doesn’t estimate the run. It describes the run. Every individual fish, classified and logged, at every hour of every day of the migration window.
What Does This Change for Summer Operations?
Summer is when the difference between a sampled and a complete data set matters most. Migration timing is shifting as climate patterns change. Peak passage hours are moving earlier in the morning as fish avoid warm midday water temperatures. If monitoring programs designed around daytime sampling windows are missing the early-morning peak, the data they’re generating systematically underestimates passage during the most active part of the day.
The FishL system runs continuously. Early morning, late night, during the two hours when a crew changeover creates a gap in manual monitoring coverage. Every fish that passes during any of those windows is counted, classified, and logged automatically.
Where Has This Been Demonstrated?
At Bonneville Dam on the Columbia River, Whooshh’s FishL Recognition system generated over 220,000 classified fish images from 12 species in a single deployment season. That dataset was made available to the National Marine Fisheries Service and produced insights into run composition and population health that the facility’s existing monitoring program hadn’t been generating.
That’s not a pilot project result. It’s a production deployment at one of the most significant salmon monitoring sites in North America. Visit the FishL Recognition product page for full specifications and deployment details.
For more context on where fish monitoring is heading, the published Whooshh Innovations blog How Are Modern Fish Monitoring Systems Transforming Fisheries covers the broader picture. Ready to talk specifics? Connect with us here.